Common spectrum analyzers mainly use digital display. Each point on the display trace represents a frequency range. This frequency range is called a “bucket”. We use some mathematical operations to extract the information data we want from this bucket, and then display the data on the display. Buckets include two concepts: “frequency” and “duration”:
Frequency: Width of signal collection unit = sweep width/(number of trace points-1)
Duration: Duration of signal collection unit = sweep time/(number of trace points-1)
Using the concept of “signal collection unit”, it can help us distinguish these 6 types of display detectors:
- Sampling detection
- Positive peak detection (abbreviated as peak detection)
- Negative peak detection
- Normal detection (Normal)
- Average detection
- Quasi-peak detection
The first three sampling detection, positive peak detection, and negative peak detection are relatively easy to understand. See Figure 1.
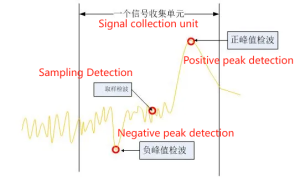
Figure 1 Schematic diagram of a signal collection unit
Sampling Detection
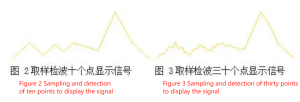
Only the instantaneous level value at the middle position of each signal collection unit (Figure 1) is selected as the data point. This is the sampling detection mode. Within the entire sweep bandwidth, the more sampling points there are, the closer it is to the real signal. In order to make the displayed trace look continuous, the sampling points can be connected to display or interpolation points that meet certain algorithms. Comparing Figures 2 and 3, the more points there are on the trace, the more realistically the analog signal can be reproduced.
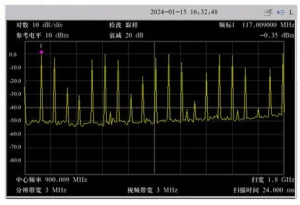
Although this sampling detection method can well reflect the randomness of noise, it is not suitable for analyzing sine waves or comb spectrum signals. As shown in Figure 4, the detection method of the spectrum analyzer is sampling, the sweep width is 1800MHz, and the number of display points is 401. Then the width of each signal collection unit is 4.5MHz, that is, each point represents a 4.5MHz bandwidth, which is greater than the 3MHz resolution bandwidth of the instrument. When the sampling detection mode is used, the amplitude of the comb signal can only be displayed when the component is exactly at the center of the intermediate frequency. It can be concluded that the sampling detection method is not suitable for all signals, nor can it display the true peak value of all signals. When the resolution bandwidth is smaller than the width of the signal collection unit, the sampling detection mode will give wrong results.
Positive peak detection
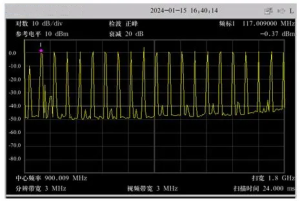
To ensure that the true amplitude of all sine waves or comb spectra can be displayed, positive peak detection, or peak detection, is used, as shown in Figure 1. Peak detection is the default detection method of many spectrum analyzers because it ensures that no sine signal is lost regardless of the relationship between the resolution bandwidth and the width of the signal collection unit, as shown in Figure 5. However, unlike the sampling detection method, peak detection only displays the maximum value within each signal collection unit and ignores the actual randomness of the noise, so it is not ideal in displaying random noise. Therefore, spectrum analyzers that use peak detection as the first detection method generally also provide sampling detection as a supplement.
Negative peak detection
Negative peak detection is also called minimum peak detection. It displays the minimum value in each signal collection unit, as shown in Figure 1. Although negative peak detection is not as common as other detection methods, most spectrum analyzers provide this detection method. For EMC measurements, negative peak detection is very useful if you want to distinguish CW signals from pulse signals.
Normal detection
Normal detection, also known as automatic peak detection or Normal detection. This detection method can better display random noise than peak detection and avoid the signal loss problem of sampling detection method. If the signal has both rise and fall as determined by positive peak and negative peak detection, the algorithm classifies this signal as a noise signal. In this case, odd-numbered data points are used to display the maximum value in the signal collection unit, and even-numbered data points are used to display the minimum value.
Normal detection algorithm: If the signal has both rise and fall in a signal collection unit: the even-numbered signal collection unit will display the minimum value (negative peak) in the unit. And record the maximum value, then in the odd-numbered signal collection unit, compare the peak value in the current unit with the peak value of the previous (recorded) unit and display the larger value (positive peak) of the two. If the signal only rises or only decreases in a signal collection unit, the peak value is displayed, as shown in Figure 6.
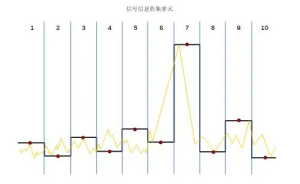
Figure 6 Display trace points selected by the normal detection algorithm
To sum up: peak detection is best for locating CW signals from noise, sampling detection is best for measuring noise, and normal detection is most appropriate when both signals and noise need to be observed.
Average detection
Because digital modulation has noise-like characteristics, sampling detection cannot provide all the information we need. For example, when measuring the channel power of a W-CDMA signal, the RMS value of the integrated signal is required. This measurement process involves the total power of the signal collection unit within a certain frequency range of the spectrum analyzer, and sampling detection cannot provide this information.
Although the general spectrum analyzer collects amplitude data multiple times in each signal collection unit, sampling detection only retains one value of this data and ignores other values; while average detection uses all the data in the signal collection unit and processes the data in multiple ways to obtain the desired results.
Some spectrum analyzers call the detection that averages the power (based on the RMS value of the voltage) rms (root mean square) detection. The average detection function of the spectrum analyzer includes power averaging, voltage averaging, and logarithmic averaging of the signal. Different averaging types can be selected separately by pressing buttons:
Power (RMS) averaging is the average of the RMS level of the signal, which is obtained by taking the square root of the sum of the squares of the voltage values measured in a signal collection unit and dividing it by the input characteristic impedance of the spectrum analyzer (usually 50 Ω). Power averaging calculates the true average power and is best suited for measuring the power of complex signals.
Voltage averaging averages the linear voltage values of the signal envelope measured within a signal collection unit. This method is often used to measure narrowband signals in EMI testing. Voltage averaging can also be used to observe the rise and fall of AM signals or pulse modulated signals (such as radar signals and TDMA transmission signals).
Logarithmic power (video) averaging averages the logarithmic amplitude values (in dB) of the signal envelope measured within a signal collection unit. It is best suited for observing sinusoidal signals, especially those close to noise.
Therefore, using the average detection method with power as the average type provides the true average power based on the RMS voltage value, while the detector with the average type as voltage can be regarded as a general average detector.
Measuring power using average detection is better than sampling detection. Sampling detection requires multiple scans to obtain enough data points to provide accurate average power information. Average detection changes the measurement of channel power from the sum of signal collection units within a certain range to the synthesis of time intervals representing a certain frequency range of the spectrum analyzer. In a Fast Fourier Transform (FFT) spectrum analyzer, the value used to measure channel power changes from the sum of displayed data points to the sum of FFT transform points.
In both swept and FFT modes, this synthesis captures all available power information, rather than just the power information at the sampling point as with sample detection. So when the measurement time is the same, the average detection results are more consistent. In swept analysis, the stability of the measurement results can also be improved simply by extending the sweep time.
Quasi-peak detection (QPD)
A quasi-peak detector is a peak detector used for interference measurement (EMI). QPD is a weighted form of peak detection, where the measured value decreases as the repetition rate of the measured signal decreases. That is, a pulse signal with a given peak amplitude and a pulse repetition rate of 10 Hz will have a lower quasi-peak value than another signal with the same peak amplitude but a pulse repetition rate of 1 kHz. This signal weighting is achieved by a circuit with a specific charge and discharge structure and a display time constant defined by CISPR to implement the quasi-peak detector charge time constant.


