Saluki S3302 series handheld spectrum analyzer has a variety of measurement functions. The updated spectrum analyzer has a new option of signal analysis measurement.
The signal analysis measurement mode is to provide the rapid analysis of interference signal, realize the display and playback of historical data by waterfall chart, quickly realize the modification of center frequency and span parameters by shortcut menu and quickly realize the audio output and IQ Capture function.
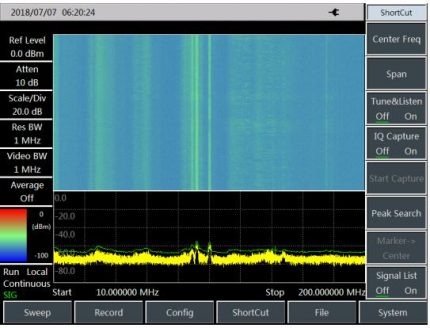
The main interface of signal analysis measurement mode will measure by reference to interference analysis waterfall chart for the convenience of observing the periodic or jumped interference signal. The signal analysis is specially designed with shortcut menu to quickly set the center frequency and span parameters, activate the audio output and IQ Capture and improve the rapid analysis of interference signal. The main interface display of signal analysis is as shown in Fig.1:

Fig.1 Main interface display of signal analysis measurement mode
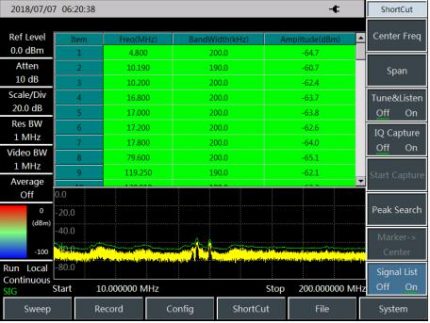
The signal analysis includes signal list menu to view the frequency, amplitude, capture time and other parameters of captured interference signal, as shown in Fig.2.

Fig.2 Interface of signal list
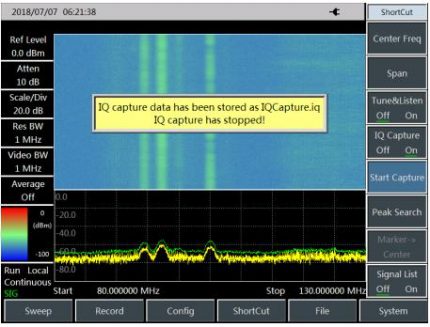
IQ Capture function can directly save IQ data of interference signal and its interface is as shown in Fig.3:

Fig.3 Schematic diagram of IQ capture function
Under the signal analysis mode, the current test task can be saved quickly as an automatically generated file as per current intermediate frequency and test time.
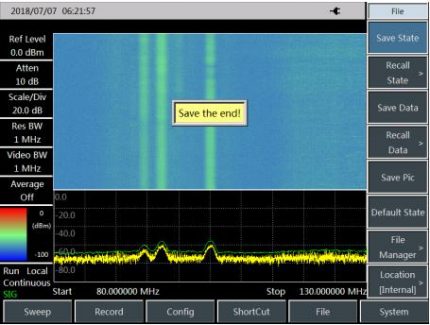
The storage task of signal analysis is as shown in Fig.4:

Fig.4 Schematic diagram of signal analysis storage task


