
Saluki S3302 series handheld spectrum analyzer has a variety of measurement functions. In this section, we mainly describe how to use the spectrum analyzer to do the signal source measurement.
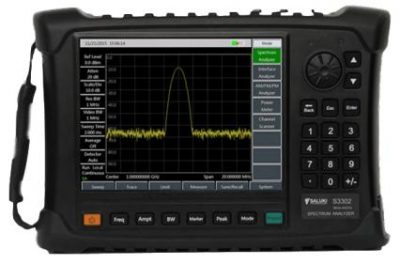
Fig.1 S3302 handheld spectrum analyzer
1. Independent Source Measurement
Under the independent source measurement mode, it is allowed to realize the signal output at fixed frequency by the following steps:
a) Press [Measure]–[Generator]–[Generator Off On], the point frequency source output will be selected by default after the Generator switch is turned on;
b) Press [Measure]–[Generator]–[Output Power 0dBm], it is allowed to set the power of output signal;
c) Press [Measure]–[Generator]–[CW Freq 1GHz], it is allowed to set the frequency of output signal.
The signal with output frequency of 1GHz and output power of 0dBm is as shown in Fig.2:
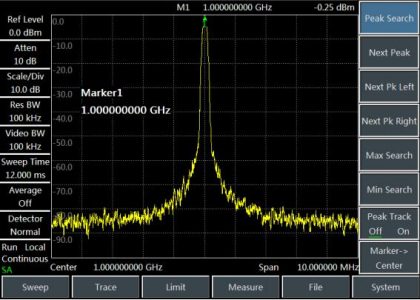
Fig.2 Schematic diagram of point frequency source output signal
2. Generator Measurement
Under the tracking mode, it is allowed to measure the magnitude-frequency characteristics of measured piece by using the synchronous frequency scan of signal source and spectral analysis. For details, please refer to the following setting procedures:
a) Press [Freq]–[Start Freq], to set the start frequency as 100MHz;
b) Press [Freq]–[Stop Freq], to set the stop frequency as 4GHz;
c) Press [Measure]–[Generator]–[Generator Off On], to start the source switch;
d) Press [Measure]–[Generator]–[Power -20dBm], to set the power of output signal;
e) Press [Measure]–[Generator]–[Mode CW Track], to change the signal source mode to tracking mode.
The schematic diagram of output signal is as shown in Fig.3:
Fig.3 Schematic diagram of tracking mode
3. Generator Normalized Measurement
The normalized measurement is to subtract the effect of cable loss from the measuring process. It can reflect the magnitude-frequency characteristics of measured piece more accurately. For example, to test the magnitude-frequency characteristics of 2.3GHz – 2.4GHz band-pass filter, it is allowed to conduct the following procedures:
a) Press [Freq]–[Start Freq], to set the start frequency as 2.1GHz;
b) Press [Freq]–[Stop Freq], to set the stop frequency as 2.6GHz;
c) Press [Freq]–[Generator]–[Generator Off On], to start the source switch;
d) Press [Measure]–[Generator]–[Mode CW Track], to change the signal source mode to tracking mode;
e) Connect the cable to signal source RF output end and frequency spectrum input end, and press [Measure]–[Generator]–[Trans Meas]–[Normalize Off On], to start the normalization switch;
f) After the scanning is completed, it is allowed to add the filter of measured piece and directly observe the magnitude-frequency characteristics of measured piece.
The magnitude-frequency characteristics diagram of 2.3GHz – 2.4GHz band-pass filter is as shown in Fig.4:
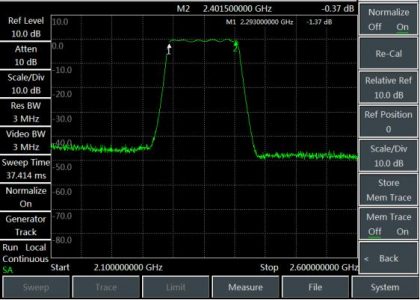
Fig.4 Magnitude-frequency characteristics diagram of 2.3GHz-2.4GHz band-pass filter
